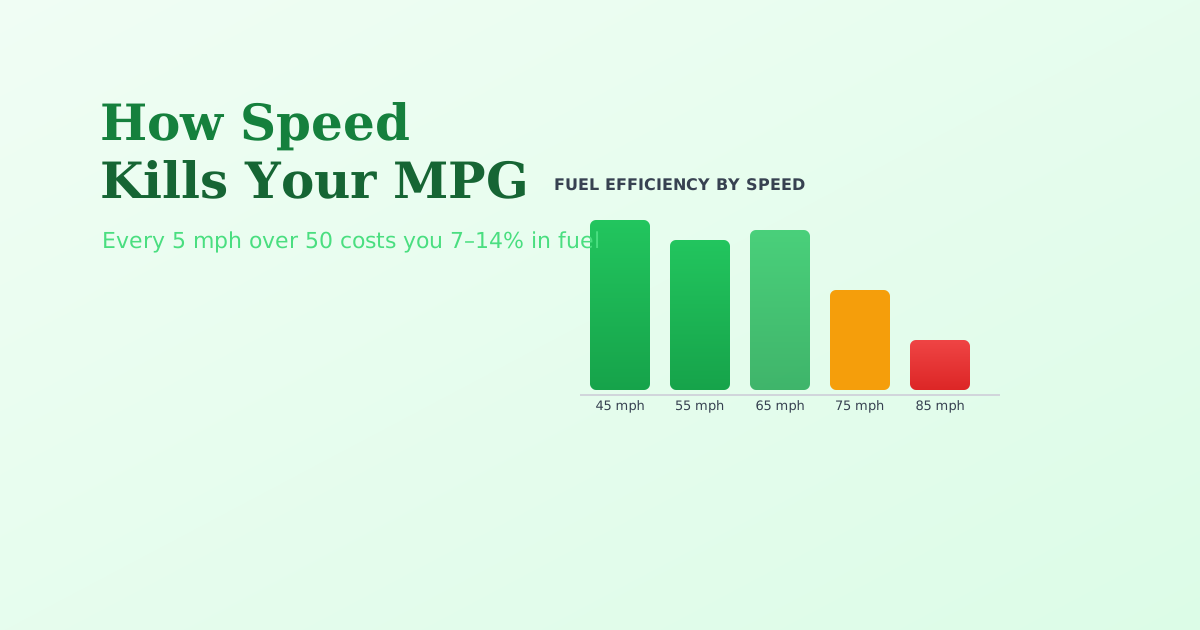
Speed is the most controllable variable in your vehicle's fuel economy — and the one most drivers ignore. The relationship between speed and fuel consumption isn't linear; it's exponential. Every 5 mph above 50 costs you 7–14% more fuel, per U.S. Department of Energy data.
For the average American driving 15,000 highway miles per year, the difference between driving 65 mph and 75 mph is worth $210–$280 per year in wasted fuel — with zero safety or convenience upside.
The Physics: Why Speed Hits MPG So Hard
Why Aerodynamic Drag Scales with the Square of Speed
Aerodynamic drag force follows the equation: F = ½ × ρ × v² × Cd × A, where v is velocity. Because velocity is squared in this formula, small speed increases create large drag increases:
- Going from 50 mph to 60 mph (+20%) increases aerodynamic drag by 44%
- Going from 50 mph to 70 mph (+40%) increases aerodynamic drag by 96% (nearly double)
- Going from 50 mph to 80 mph (+60%) increases aerodynamic drag by 156%
At highway speeds above 50 mph, aerodynamic drag is the dominant resistance force on your vehicle — more than rolling resistance, driveline friction, or any other factor. The engine must overcome all of this drag with fuel combustion.
EPA Data: MPG vs. Speed
The U.S. Department of Energy's Oak Ridge National Laboratory has measured real-world fuel economy across various speeds for a range of vehicles. The data shows consistent patterns:
- 45–55 mph — Optimal fuel economy for most passenger vehicles
- 60 mph — ~5% below peak MPG (minor penalty, reasonable speed)
- 65 mph — ~10–12% below peak MPG
- 70 mph — ~17% below peak MPG
- 75 mph — ~23% below peak MPG
- 80 mph — ~28–32% below peak MPG
A vehicle rated at 35 MPG at optimal speed effectively gets 27–28 MPG at 80 mph. That's a 7–8 MPG real-world difference that your EPA window sticker never shows you.
What It Costs in Dollars
Estimated Annual Fuel Cost Difference by Speed
Assumptions: 15,000 miles/year total, 60% highway miles (9,000 miles), vehicle base MPG of 32 at 60 mph, gas price $3.50/gallon.
- 60 mph: 281 gallons highway → $984/year in highway fuel
- 65 mph: 298 gallons highway → $1,043/year (+$59)
- 70 mph: 319 gallons highway → $1,117/year (+$133)
- 75 mph: 344 gallons highway → $1,204/year (+$220)
- 80 mph: 374 gallons highway → $1,309/year (+$325)
The difference between 60 mph and 80 mph is 93 gallons per year — about 2.5 full fill-ups worth of wasted fuel.
Cruise Control: The Simple Fix
Human drivers unconsciously vary speed by ±3–7 mph during highway cruising — drifting up, then braking back, repeatedly. Each upward drift burns more fuel; cruise control eliminates this waste.
Studies show cruise control improves highway fuel economy by 7–14% on flat roads. Combined with slowing from 75 to 65 mph, using cruise control can cut highway fuel consumption by 20–25%.
Note on hilly terrain: Cruise control maintains speed up hills by flooring the throttle, which can hurt efficiency on rolling roads. In hilly terrain, predictive cruise (available on newer vehicles) and manual throttle management may perform better.
The Time Trade-Off
Driving 65 mph vs. 75 mph on a 100-mile trip takes about 7.5 minutes longer. Is $0.40–$0.60 in fuel worth 7.5 minutes? That math favors slowing down — especially considering that real-world traffic, speed limits, and stop-and-go conditions mean the actual time difference on most real trips is 3–5 minutes or less.